
Stenotic flow reserve derived from quantitative coronary angiography has modest but incremental value in predicting functionally significant coronary stenosis as evaluated by fractional flow reserve
Introduction
Revascularisation of stable coronary stenoses contingent upon functional significance is superior to anatomical assessment of lesion severity alone (1,2). Fractional flow reserve (FFR) is the current gold standard in the functional assessment of coronary artery stenosis and is invasively derived from the ratio of distal to proximal coronary pressure across a lesion during maximal coronary flow (3). Australian data indicate that FFR is used in <5% of cases of planned percutaneous coronary intervention (PCI) (4) and thus visual assessment of angiographic diameter stenosis (DS) remains the cornerstone of decision-making in routine clinical practice. This is despite knowledge that visual assessment of lesion severity, except in lesions causing >90% stenosis, correlates poorly with functional significance (5). It is therefore important to investigate potential adjunctive angiographic parameters that may improve accuracy in predicting functional significance from angiographic images. Previous studies have shown that stenotic flow reserve (SFR), generated by computer algorithms from quantitative coronary angiography (QCA)-derived dimensions, correlates with ischaemia assessed on pharmacological stress echocardiography and perfusion imaging (6,7). Accordingly, we sought to compare the diagnostic accuracy of SFR together with DS derived by QCA to predict significant FFR.
Methods
Patients
We retrospectively examined patients with stable coronary artery disease who underwent coronary angiography and FFR assessment at a major tertiary referral hospital (Monash Health, Melbourne) between January 2010 and February 2012.
All patients who had at least 1 target vessel with >30% angiographic DS on visual estimation were included in the study. Only arteries that corresponded with normal left ventricular segments of contractile function assessed by either echocardiogram or left ventriculogram, were included in the study. Exclusion criteria included bypass graft lesions, significant left main stenosis (DS >50% on visual estimation), culprit vessels which collateralised other vessels, culprit vessels in the setting of myocardial infarction and cases in which the FFR wire failed to cross the lesion due to tight stenosis or tortuosity. In addition, patients with acute myocardial infarction seen within 48 hours after onset of presenting symptoms were excluded from the study. The study was approved by the Institutional Human Research Ethics Committee.
Invasive coronary angiography and FFR
Invasive coronary angiography was performed via either a femoral or radial approach. Intracoronary glyceryl trinitrate (100 mcg) was injected to minimise coronary vasospasm. The pressure wire (Pressure Wire Certus, St Jude Medical Systems, Uppsala, Sweden) was calibrated and electronically equalised with the aortic pressure before being placed distal to the stenosis in the distal third of the coronary artery being interrogated. Maximal hyperaemia was achieved with peripherally administered intravenous adenosine (140 mcg/kg/min) through an 18 G antecubital intravenous cannula. At steady-state hyperaemia, FFR was assessed using the RadiAnalyser Xpress (Radi Medical Systems, Uppsala, Sweden), calculated by dividing the mean coronary pressure measured with the pressure sensor placed distal to the stenosis by the mean aortic pressure measured through the guide catheter. FFR of ≤0.8 was taken to define ischemia in the interrogated artery and its supplied territory (2,8).
QCA analysis
Patients underwent routine coronary angiography with cine images acquired at 15 frames per second (Infinix-I DFB-8000D, Toshiba America Medical Systems, Tustin, CA, USA). Pixel size was determined with automated distance calibration and all analyses were performed on frames demonstrating optimal luminal opacification. Optimal angiographic views with minimal foreshortening were selected. Studies with suboptimal coronary angiography were excluded from analysis. An experienced cardiologist (BS Ko), who was blinded to FFR findings, performed all QCA measurements using a semi-automated edge detection system (QAngio XA 7.3, Medis, Leiden the Netherlands). The proximal and distal limits of the lesion were defined by manual inspection (corresponding to the sites of minimal luminal encroachment i.e., <10% disease). The semi-automated edge-detection software then traced the lesion contours and determined the reference vessel diameter and luminal diameter at maximal obstruction. From these geometric variables the minimal lumen diameter (MLD) defined as the smallest luminal diameter in the segment of interest, % DS and DS >50%, were automatically calculated. The software generates the fluid dynamic parameters of SFR, Poiseuille resistance (PR) and turbulent resistance (TR). SFR is a calculated theoretical pressure drop across a coronary stenosis (supplementary) that assumes resting coronary flow velocity (15 cm/s) and accounts for laminar flow resistance and turbulent flow resistance. Both are of importance as a laminar flow pattern operates in the most proximal portion of the lesion to the point of maximal stenosis and distal to this turbulent flow predominates (9). Calculation of PR incorporates lesion length, cross-sectional area of the stenosis and assumed blood viscosity. TR incorporates cross-sectional area of the stenosis and the reference vessel adjacent to the stenosis with assumed blood velocity and density (9).
Statistical analysis
Continuous variables are expressed as mean value ± standard deviation (SD). Categorical variables are expressed as percentage. Chi-squared test was used to test the association between categorical variables. Comparison of categorical and continuous variables was performed using independent t-test or Mann-Whitney test as appropriate after testing for normality of distribution. The diagnostic accuracy of QCA variables to predict significant FFR was performed using receiver operator characteristic (ROC) analysis. A cut-off value that optimised sensitivity and specificity was then retrospectively determined. Global comparison of areas-under-the-ROC curve was performed (10). Incremental clinical utility of SFR was assessed using the net reclassification and integrated discrimination improvement (IDI) index (11). Statistical analysis was performed with SPSS 20.0 (SPSS Inc., Chicago, IL, USA) and STATA 12.1 (StataCorp, College Station, TX, USA). A two tailed P value <0.05 was considered statistically significant.
Results
Two hundred and seventy two patients who had undergone angiography and FFR were reviewed. Mean age was 64±11 years and 70% were male. In total, 415 vessels were examined. There were 180 (43%) vessels that were FFR significant. The mean FFR value for all vessels was 0.81±0.11. Table 1 summarises the patient and vessel characteristics.

Full table
Accuracy of DS and MLD on invasive QCA to predict FFR ≤0.8
On a per vessel basis, 121 (29%) vessels had >50% stenosis on QCA. The diagnostic accuracy of DS >50% for predicting significant FFR had a sensitivity of 47%, specificity of 82%, positive predictive value (PPV) of 68% and negative predictive value (NPV) of 66%. On ROC analysis, the AUC for DS >50% for predicting significant FFR was 0.65 (95% CI, 0.58–0.66).
There were 20 (5%) vessels which had >70% stenosis on QCA. The diagnostic accuracy of DS >70% for predicting significant FFR had a sensitivity of 9%, specificity of 98%, PPV of 80% and NPV of 58%. On ROC analysis, the AUC for DS >70% for predicting significant FFR was 0.54 (95% CI, 0.6–0.78).
On ROC analysis, the AUC for MLD for predicting significant FFR was 0.71 (95% CI, 0.65–0.76). A retrospectively determined MLD cut-off value of 1.1 mm had a sensitivity of 39%, specificity of 85%, PPV of 67% and NPV of 64% for predicting significant FFR (Table 2).

Full table
Accuracy of SFR, TR and PR on invasive QCA to predict FFR ≤0.8
On ROC analysis, SFR had an AUC of 0.76 (95% CI, 0.72–0.81) for predicting significant FFR (Figure 1). Based on a retrospectively determined cut-off value of 3.51 that optimized sensitivity and specificity for predicting significant FFR, the sensitivity, specificity, PPV and NPV were 56%, 81%, 70% and 71% respectively. Vessels with SFR <3.51 had lower FFR compared to those with SFR >3.51 (0.75±0.12 vs. 0.84±0.09, P<0.001). On analysis of left anterior descending artery (LAD) lesions alone the sensitivity, specificity, PPV and NPV were 56%, 86%, 80% and 66% respectively.

On ROC analysis, the AUC for PR for predicting significant FFR was 0.75 (95% CI, 0.70–0.80). A retrospectively determined PR cut-off value of 1.96 was associated with sensitivity, specificity, PPV and NPV of 46%, 83%, 68% and 67% respectively for predicting significant FFR.
On ROC analysis, the AUC for TR for predicting significant FFR was 0.69 (95% CI, 0.63–0.74). A retrospectively determined TR cut-off value of 2.1 was associated with sensitivity, specificity, PPV and NPV of 42%, 78%, 60% and 64% respectively for predicting significant FFR. Table 2 summarises the diagnostic accuracy of QCA parameters in predicting significant FFR.
The r value for correlation between FFR and SFR, PR and TR was 0.47 (P<0.001), −0.19 (P<0.001) and −0.13 (P=0.008), respectively.
Figure 2 plots SFR with regards to percent DS for the 415 vessels analysed. This demonstrates both the distribution of severity of vessel stenosis by these two measures and the expected negative correlation.

Diagnostic accuracy of SFR compared to DS >50% for predicting significant FFR
By comparison of ROC, SFR (AUC =0.76) is superior to DS >50% (AUC =0.65) for predicting significant FFR (P<0.001). Based on net reclassification index (NRI) analysis, there is incremental predictive value when SFR is added to DS >50% for predicting significant FFR (NRI =0.75, P<0.001). On comparison of ROC curves using the De Long method, SFR was superior compared to DS >50% for predicting significant FFR (P=0.02). Based on IDI index there is also incremental predictive value (IDI =0.103, P<0.001).
Diagnostic accuracy of SFR compared to DS >70% for predicting significant FFR
Based on NRI analysis, there is incremental predictive value when SFR is added to DS >70% for predicting significant FFR (NRI =0.73, P<0.001).
Discussion
In this study, we compared the diagnostic accuracy of DS and QCA-derived flow dynamic parameters for assessment of functional significance of coronary artery stenosis using FFR as the reference standard. We showed that SFR had higher diagnostic accuracy than DS for predicting significant FFR. In addition, SFR had incremental predictive value when added to DS for predicting significant FFR. Overall, SFR had high specificity but only moderate sensitivity to predict significant FFR.
DS and functional significance of coronary artery stenosis
Although clinical decision making about revascularisation is often guided by angiography derived DS assessment, recent studies have shown only modest correlation between DS on coronary angiography and the lesion’s functional severity assessed by FFR (12). One recent study by Park et al. reported the “mismatches” in 57% of non-left main lesions between angiographic DS >50% and FFR <0.8 (12). These authors also reported a weak correlation between QCA derived MLD (r=0.414) and FFR which is comparable to our study finding (r=0.39). Meanwhile a meta-analysis of 18 studies found that overall concordance of DS by QCA with FFR was poor, especially in the moderate range of lesion severity (13). Angiography derived DS >50% had 51% sensitivity and 78% specificity at predicting significant stenosis by FFR. Concordance for stenoses <30% was good at 95% but for moderate (30–70%) and severe (70%) this dropped to 61% and 67% respectively. This is consistent with our study findings that showed that DS >50% had a sensitivity of 47% and specificity of 82% for predicting significant FFR. The modest association between DS and functional significance of coronary stenosis is unsurprising, as it has long been understood that the pressure gradient across coronary artery stenoses is not only influenced by the minimum radius. As defined by Poiseuille’s law of fluid dynamics, pressure gradient is influenced by coronary blood flow and viscosity, minimum radius, and lesion length. In effect, the gradient across coronary stenoses is inversely proportional to the fourth power of the lesion radius (r4) and is proportional to lesion length (14). The influence of turbulence on pressure gradient, determined in part by lesion geometry, is also significant and becomes the predominant contributor to pressure gradient at high flow rates (15). Therefore, angiography derived fluid dynamic parameters that take into account lesion length and cross-sectional area may have better diagnostic accuracy than DS alone.
Evolution of SFR
There has been much recent interest in computational fluid dynamics for predicting functional significance of coronary artery stenosis using computed tomography coronary angiography (16). However, angiography derived fluid dynamic parameters such as SFR, Poiseuille and TRs have been studied since the 1970s (9,15,17,18). Detailed early works applied Poiseuille’s law of fluid dynamics (laminar flow) as well as turbulent flow principles to mathematically model the complex interactions between lesion geometry (lesion length, cross-sectional area, exit angles etc.), viscosity, flow and pressure gradient. Canine models of femoral and coronary stenoses (9,18,19) lead to the validation of a formula for the predicted pressure drop across a stenosis, now known as SFR (supplementary materials).
Kirkeeide et al. (17) used SFR to generate ‘predicted’ coronary flow reserve (CFR) and correlate it with invasively measured CFR, again in a canine model of coronary stenosis. ‘Predicted’ CRF was calculated using a mathematical model combining SFR and aortic pressure for 18 different stenosis severities (17). Predicted CFR and measured CFR correlated closely with an r value of 0.91.
SFR and functional significance of coronary artery stenosis
Subsequently SFR has shown great promise as a predictor of ischemia assessed by non-invasive methods. In patients with single vessel coronary lesions, SFR has been found to better predict ischaemia-producing coronary stenosis by myocardial perfusion imaging (20) and dipyridamole stress echocardiography (6) when compared with DS on QCA. With ischaemia defined by positive dipyridamole stress echocardiography, SFR with an optimized cut-off of 2.8 had a sensitivity of 100% and specificity of 90% (P=0.0001). The discriminative value of an optimised DS cut-off value of 59% in predicting positive stress echo had a sensitivity and specificity of 91% and 95% respectively (6). In multivariate analysis including SFR, MLD, DS and CFR by intracoronary Doppler measurement, SFR was the only independent predictor of ischaemia by dipyridamole echocardiography (6).
Our study is therefore consistent with previous studies demonstrating the superior diagnostic accuracy of SFR over DS for ischaemia-producing stenoses. This stands to reason given that SFR combines several dimensions of the stenosis and their influence on blood flow (17), whilst DS is just a single dimension known to influence flow. To the contrary, one study found that the discriminative value of SFR was inferior to DS >50% and MLD <1.5 mm for the prediction of myocardial FFR (FFRmyo) in a cohort of 110 patients undergoing elective single-vessel PCI (21). FFRmyo conceptually factors in collateral flow to the pressure drop across a stenosis and is thus different from coronary FFR (FFRcor) as measured in our study. FFRcor was also measured in the aforementioned study but it was not tested against SFR, MLD and DS >50%. Presumably this analysis was not pursued given the much weaker correlations observed between these QCA variables and FFRcor than with FFRmyo. For example the correlation of SFR with FFRmyo had a r value of 0.78, while with FFRcor the r value was 0.33. We observed a better but still moderate SFR-FFRcor correlation (r=0.47).
While SFR had the best overall diagnostic accuracy in our study, the sensitivity (using an optimal cut-off of 3.51) was modest at 56%, although still higher than DS, MLD and all other QCA derived parameters. There are several possible explanations for this. The formula for SFR makes several assumptions that may be relevant, especially in complex lesions not modeled by early experimental work. While SFR combines some geometric and fluid dynamic parameters it does not account for lesion eccentricity, exit angle and flow pulsatility (17). Exclusion of these factors may lead to underestimation of stenosis severity. Flow pulsatility, for example, generates turbulence that leads to significant pressure loss, especially across stenotic lesions of >75% severity (22). Another factor contributing to FFR is the myocardial mass subtended by the stenosed coronary vessel such that a proximal stenosis in a major epicardial vessel will exert greater haemodynamic significance than a more distal lesion (23,24). SFR does not account for this influence as it physiologically isolates the stenosis from the remainder of the coronary circulation. This may result in varying effects on the relationship between SFR and FFR for a given lesion depending upon the lesions’ location. Similarly caution needs to be exercised in applying SFR in scenarios such as tandem lesions, bifurcational lesions and lesions protected by a collateral circulation. As the overall diagnostic accuracy of SFR is only modest in this study, we believe further refinements of SFR are still required.
Limitations
We assessed SFR in predominantly multi-vessel disease, and while this may have tested its utility in a wider potential population it does not reflect the models from which it was derived. However when we excluded lesions in major arterial branches and applied SFR to LAD lesions alone there was no significant improvement in its predictive value. Measurement errors pertaining to the angiographic image attainment (i.e., vessel foreshortening and suboptimal opacification) and subsequent QCA analysis using semi-automated edge detection software may occur. With reference to the SFR calculation, an inaccuracy in the measurement of some dimensions will have more impact than others i.e. cross-sectional area within the second term as this term is squared.
Clinical implications
This study advances understanding of the utility of SFR, a fluid dynamic parameter computed on QCA. We are the first to truly assess and report its discriminative value (in comparison with other QCA variables), and suggest a cut-off value for the prediction of ischaemia-producing lesions as determined by the gold standard FFR. Despite the promise shown by SFR in prediction of ischemia measured non-invasively, we do not believe that SFR can reliably replace invasive transtenotic pressure gradient evaluation given its moderate sensitivity. Nonetheless, the pursuit and interrogation of non-invasive surrogates such as SFR is founded given the slow uptake of FFR in some regions.
Whilst at present our data suggest SFR has limited utility due it’s modest sensitivity relating largely to incomplete modeling of lesion morphology and inability to reflect distal myocardial demand, recent advances in QCA techniques have begun to address this. A 3D QCA-based model uses angiographic images to create a 3D reconstruction of the lesion and vessel volume in a segment of interest. Blood flow in the section of interest is calculated based on contrast transit time between sequential frames. Blood density and viscosity are derived from the patient’s haematocrit and incorporated into the calculations (whereas this is assumed in the SFR model). Tu et al. (25) demonstrated excellent agreement between this model of FFR (FFRQCA) and invasive FFR assessment in 77 vessels, with an area under the receiver-operator curve of 0.93. The widespread applicability of this software remains to be seen but this work demonstrates ongoing refinements to coronary stenosis assessment using QCA. Further studies would be ideal to assess whether combining SFR and FFRQCA will have incremental predictive value in predicting functionally significant stenosis. Furthermore if these techniques can be performed promptly “online” using QCA in the catheterization laboratory, then these two techniques may be complementary in aiding clinicians with revascularization strategy decision-making.
Conclusions
SFR with an optimised cut-off value of 3.51 has modest diagnostic accuracy for predicting significant FFR. SFR does however add incremental predictive value to DS >50% for predicting significant FFR.
Acknowledgements
Dr. DT Wong is supported by Early Career Fellowship from the National Health and Medical Research Council Australia. Dr. PJ Psaltis is supported by Future Leaders Fellowship from the National Heart Foundation Australia.
Footnote
Conflicts of Interest: The authors have no conflicts of interest to declare.
Ethical Statement: The study was approved by the Institutional Human Research Ethics Committee.
Supplementary
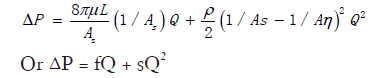
Fluid dynamic equation for pressure drop (ΔP) across a stenosis in terms of flow volume (Q). μ = blood viscosity, L = stenosis length, Aη = cross-sectional area of reference vessel, As = cross-sectional area of stenotic segment, ρ = blood density. f and s coefficient of pressure loss due to viscous friction (laminar flow) and exit separation (turbulent flow) (17).
References
- De Bruyne B, Pijls NH, Kalesan B, et al. Fractional flow reserve-guided PCI versus medical therapy in stable coronary disease. N Engl J Med 2012;367:991-1001. [Crossref] [PubMed]
- Tonino PA, De Bruyne B, Pijls NH, et al. Fractional flow reserve versus angiography for guiding percutaneous coronary intervention. N Engl J Med 2009;360:213-24. [Crossref] [PubMed]
- Pijls NH, De Bruyne B, Peels K, et al. Measurement of fractional flow reserve to assess the functional severity of coronary-artery stenoses. N Engl J Med 1996;334:1703-8. [Crossref] [PubMed]
- Harper RW, Ko BS. A new algorithm for the management of stable coronary artery disease incorporating CT coronary angiography and fractional flow reserve: how we can improve outcomes and reduce costs. Med J Aust 2011;194:186-9. [PubMed]
- Tonino PA, Fearon WF, De Bruyne B, et al. Angiographic versus functional severity of coronary artery stenoses in the FAME study fractional flow reserve versus angiography in multivessel evaluation. J Am Coll Cardiol 2010;55:2816-21. [Crossref] [PubMed]
- Danzi GB, Pirelli S, Mauri L, et al. Which variable of stenosis severity best describes the significance of an isolated left anterior descending coronary artery lesion? Correlation between quantitative coronary angiography, intracoronary Doppler measurements and high dose dipyridamole echocardiography. J Am Coll Cardiol 1998;31:526-33. [Crossref] [PubMed]
- Gottsauner-Wolf M, Sochor H, Moertl D, et al. Assessing coronary stenosis. Quantitative coronary angiography versus visual estimation from cine-film or pharmacological stress perfusion images. Eur Heart J 1996;17:1167-74. [Crossref] [PubMed]
- Kern MJ, Samady H. Current concepts of integrated coronary physiology in the catheterization laboratory. J Am Coll Cardiol 2010;55:173-85. [Crossref] [PubMed]
- Brown BG, Bolson E, Frimer M, et al. Quantitative coronary arteriography: estimation of dimensions, hemodynamic resistance, and atheroma mass of coronary artery lesions using the arteriogram and digital computation. Circulation 1977;55:329-37. [Crossref] [PubMed]
- DeLong ER, DeLong DM, Clarke-Pearson DL. Comparing the areas under two or more correlated receiver operating characteristic curves: a nonparametric approach. Biometrics 1988;44:837-45. [Crossref] [PubMed]
- Pencina MJ, D'Agostino RB Sr, D'Agostino RB Jr, et al. Evaluating the added predictive ability of a new marker: from area under the ROC curve to reclassification and beyond. Stat Med 2008;27:157-72; discussion 207-12. [Crossref] [PubMed]
- Park SJ, Kang SJ, Ahn JM, et al. Visual-functional mismatch between coronary angiography and fractional flow reserve. JACC Cardiovasc Interv 2012;5:1029-36. [Crossref] [PubMed]
- Christou MA, Siontis GC, Katritsis DG, et al. Meta-analysis of fractional flow reserve versus quantitative coronary angiography and noninvasive imaging for evaluation of myocardial ischemia. Am J Cardiol 2007;99:450-6. [Crossref] [PubMed]
- Kimball BP, Dafopoulos N. LiPreti V. Comparative evaluation of coronary stenoses using fluid dynamic equations and standard quantitative coronary arteriography. Am J Cardiol 1989;64:6-10. [Crossref] [PubMed]
- Lipscomb K, Hooten S. Effect of stenotic dimensions and blood flow on the hemodynamic significance of model coronary arterial stenoses. Am J Cardiol 1978;42:781-92. [Crossref] [PubMed]
- Nørgaard BL, Leipsic J, Gaur S, et al. Diagnostic performance of noninvasive fractional flow reserve derived from coronary computed tomography angiography in suspected coronary artery disease: the NXT trial (Analysis of Coronary Blood Flow Using CT Angiography: Next Steps). J Am Coll Cardiol 2014;63:1145-55. [Crossref] [PubMed]
- Kirkeeide RL, Gould KL, Parsel L. Assessment of coronary stenoses by myocardial perfusion imaging during pharmacologic coronary vasodilation. VII. Validation of coronary flow reserve as a single integrated functional measure of stenosis severity reflecting all its geometric dimensions. J Am Coll Cardiol 1986;7:103-13. [Crossref] [PubMed]
- Gould KL. Pressure-flow characteristics of coronary stenoses in unsedated dogs at rest and during coronary vasodilation. Circ Res 1978;43:242-53. [Crossref] [PubMed]
- Young DF, Cholvin NR, Roth AC. Pressure drop across artificially induced stenoses in the femoral arteries of dogs. Circ Res 1975;36:735-43. [Crossref] [PubMed]
- Zijlstra F, Fioretti P, Reiber JH, et al. Which cineangiographically assessed anatomic variable correlates best with functional measurements of stenosis severity? A comparison of quantitative analysis of the coronary cineangiogram with measured coronary flow reserve and exercise/redistribution thallium-201 scintigraphy. J Am Coll Cardiol 1988;12:686-91. [Crossref] [PubMed]
- Bartúnek J, Sys SU, Heyndrickx GR, et al. Quantitative coronary angiography in predicting functional significance of stenoses in an unselected patient cohort. J Am Coll Cardiol 1995;26:328-34. [Crossref] [PubMed]
- Ku DN. Blood flow in arteries. Annu Rev Fluid Mech 1997;29:399-434. [Crossref]
- Wong DT, Narayan O, Ko BS, et al. A novel coronary angiography index (DILEMMA score) for prediction of functionally significant coronary artery stenoses assessed by fractional flow reserve: A novel coronary angiography index. Am Heart J 2015;169:564-71.e4. [Crossref] [PubMed]
- Bishop AH, Samady H. Fractional flow reserve: critical review of an important physiologic adjunct to angiography. Am Heart J 2004;147:792-802. [Crossref] [PubMed]
- Tu S, Barbato E, Köszegi Z, et al. Fractional flow reserve calculation from 3-dimensional quantitative coronary angiography and TIMI frame count: a fast computer model to quantify the functional significance of moderately obstructed coronary arteries. JACC Cardiovasc Interv 2014;7:768-77. [Crossref] [PubMed]

