
Aortic flow conditions predict ejection efficiency in the NHLBI-Sponsored Women’s Ischemia Syndrome Evaluation (WISE)
Introduction
Multiple aspects of the cardiovascular system have been successfully modeled using resistive, inductive and capacitive circuit elements (1). In these models, resistance is typically associated with the microvasculature, capacitance represents compliance of the cardiovascular system (typically focusing on large conduit vessels such as the aorta) and inductance represents blood inertia. Others have shown that the pulsatile and periodic ejection of blood can be considered to be a wave phenomenon transmitting into a “tuned” system. Here we show that the left ventricular (LV) ejection of blood into the aorta can be characterized by an impedance which can be dominantly capacitive or a dominantly inductive in this tuned system (2). A typical behavior of tuned circuits is that at frequencies lower than resonance the impedance is predominantly capacitive, while at frequencies higher than resonance the impedance is predominantly inductive. A resonance condition is observed when the two sources of impedance are balanced to produce a low net impedance/resistance, Figure 1. Of special interest here, when the frequency exceeds one end of a tuned band, there is a sudden transition from maximal inductive impedance to maximal capacitive impedance. We show that the cardiovascular system behaves as a tuned circuit with periodic resonances observed at approximately 10% intervals of ejection fraction (EF), e.g., for an individual, resonances might occur at 55%, 65% and 75% etc. Further, major adverse cardiovascular events may be more likely to occur when ejection conditions are remote from the local resonance condition (likely reflecting the high mechanical work load associated with high impedance). We introduce these concepts in terms of an aortic Flow Index which reflects impedance conditions within each EF range, illustrating its prognostic potential and use as a surrogate for likely adjustments made by the cardiac and vascular system to accommodate a variety of cardiac loading conditions.

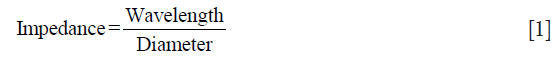
While cardiovascular magnetic resonance (CMR) chamber volumetric imaging is widely regarded as the gold standard for calculating left ventricular ejection fraction (LVEF), reproducibility is at best 4% (3). As an alternative, we sought to measure ejection impedance conditions more directly by examining blood flow in the ascending aorta and relating them to LVEF. The pulsatile and periodic ejection of blood can be considered to be a wave phenomenon transmitting into a tuned circuit, analogous to the transmission of sound waves by a loud-speaker. In the case of the loud-speaker, impedance is optimal when the ratio of the diameter of the sound wave and the speaker are close to one, Eq. [1]:
Here, two patient populations were examined, the first population was used to develop a method to measure and characterize left ventricular-aortic impedance, and the second population was used to illustrate its potential prognostic value.
Methods
Model development population
To assess impedance and examine its relationship to EF we performed a retrospective review of patients undergoing a CMR volumetric evaluation of the LV between January 1 2012 to June 1 2015, and in whom a phase velocity scan of aortic flow was available. The Institutional Review Board approved this retrospective use of data. Patients with aortic stenosis were excluded to avoid distortion of the aortic flow pattern. We identified 112 male and female subjects who were evaluated for a wide variety of conditions including LV function evaluation, valvular assessment, myocardial infections and pulmonary artery hypertension. The ejection fractions ranged from 9% to 76% and demographics are given in Table 1.

Full table
The flow wavelength is difficult to measure directly, and here we use parameters that are proportional to wavelength and that are widely assessable from the clinical CMR data, which are used to form a Flow Index. Classically, wavelength (λ) is related to wave velocity and frequency by Eq. [2]:

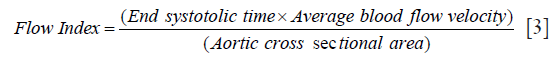
Frequency is inversely proportional to the pulse time, and here we used the inverse of the end-systolic ejection time as proportional to the frequency term. Pulsatile blood contains multiple oscillatory velocity terms (which can be quantified by Fourier analysis) but it has been noted that the zeroth Fourier Coefficient of flow is undistorted by non-linear aspects of the intact cardiovascular system (4). Here the zeroth Fourier coefficient, corresponding to average velocity of blood in the aortic outflow tract, was used. Since the aortic outflow tract is typically circular in cross section we took the aortic area as representative of the diameter of the transmission orifice, yielding the Flow Index formula:
Medis analysis software (Leiden, the Netherlands) was used to contour the aorta in the phase velocity scans to extract the flow parameters of average flow velocity and the area of the aorta. Ejection fraction was calculate from the end diastolic and end systolic left ventricular volumes extracted from a contiguous series of short axis slices covering the LV from base to apex using the Medis software to contour the endocardial LV boundaries. For each tuned band the Flow Index was fitted to model the volumetric EF using a power relationship. For the full range of EF, the power relationship terms were manually adjusted to minimize the least square error between the measured EF and the modeled EF.
Prognostic illustration population
To illustrate the potential for prognostic value we studied a separate population of women with ischemic heart disease in whom follow-up data existed. Among the 935 Women’s Ischemia Syndrome Evaluation (WISE) participants undergoing a clinically indicated coronary artery angiography, a sub-population consisting of 213 women with suspected myocardial ischemia also underwent a clinically indicated CMR functional evaluation. This prospective sub-study was performed at a single WISE site, the University of Alabama at Birmingham, and included those with no contraindications for CMR examination. All subjects provided written informed consent using forms and procedures approved by the Institutional Review Board. The WISE study design and methodology have been previously described (5,6). In brief, upon enrollment, demographic, CAD risk factors, medical and reproductive history, and functional capacity data were collected as well as blood sampling for Lipid Core Laboratory evaluation. Only patients with CMR EF data were included for this analysis (n=201).
Follow-up consisted of a scripted telephone interview performed by an experienced WISE Research Coordinator at 6-week after enrollment and annually thereafter. The major adverse cardiovascular events (MACE) collected were reduced from the standard WISE MACE to only include cardiovascular-related mortality, first incidence of nonfatal myocardial infarction or hospitalization for heart failure. Follow-up was conducted for 38±14 months. In the event of death, a death certificate and/or hospital record was obtained and a panel of experts adjudicated whether death was cardiovascular related using predetermined criteria.
Statistical analysis
Continuous values were presented as mean ± SD and categorical variables as percent frequency. Continuous clinical and demographic characteristics were compared between groups using the independent samples t-test; the chi-square test was used for categorical comparisons. Logistic regression was conducted for variables ordered by Flow Index. MACE rate was assessed with respect to EF characteristics independently of other predictors of MACE. Model fitting of parameters was optimized by minimizing the least squares error between the modeled and measured values. Bland-Altman analysis was used to compare multiple measures of the same parameter. Response to MACE was evaluated using receiver-operator characteristics (ROC) curve analysis. All statistical tests were two-tailed and a p value <0.05 was considered to be statistically significant. Statistical analyses were performed using IBM SPSS version 21.0 (IBM SPSS Inc., Armonk, New York, USA).
Results
Flow Index association with EF in the development population
The mean age of patients in the development population was 54±16 years with demographic data summarized in Table 1. The Flow Index components of wavelength and aortic area are plotted along with the Flow Index ordered by 6 EF bands, with each band representing approximately a 10% range of EF, Figure 2. Band 6 corresponds to the lowest EF range (10–20%) and band 1 corresponds to EFs in the range 60% and higher. The vertical dashed lines indicate the natural boundary between EF bands, corresponding to positions of the periodic discontinuities of the Flow Index. Within each EF band, the Flow Index was related to EF by a power formula of the form:


Where EFB is a base line number and Power is the power that the Flow Index is raised to, Table 2 summarizes the parameter values for each band, Figure 3. When fitted over the full EF range, the modeled EF correlated with the measured EF with an r2 value of 0.95. Bland-Altman analysis of modeled and measured EF demonstrated a bias offset of 0.1% and a standard deviation of 3.4%. Figure 4 shows that the modeled and measured EF vary smoothly over the 6 EF bands, while the corresponding Flow Index varies in the periodic discontinuous cyclic manner described in Figure 1.

Full table


Prognostic value in the illustration population
In the development population we showed that approximately each decade band of EF corresponded to a tuned band of the CV system. However, in the illustration population (i.e., exclusively WISE women), we did not capture aortic flow, but instead had access to the CMR-measured EF which, as shown above, can be directly related to the Flow Index. In the illustration WISE population the EF range was 22–82% with a mean of 62%±11%. Figure 5 shows the MACE rate vs. EF for the WISE population for EFs in the range 60–79%. It is clear that two very distinct peaks of MACE rate are noted which are separated by approximately a 10% EF interval. For illustrative purposes, we repeated this clear pattern of MACE rate for each EF band and constructed a parameter, Deltacenter, which characterizes the distance in EF units from the center position within each EF band between the peak positions of MACE. The Deltacenter parameter was entered into a ROC analysis, along with the raw EF values, and generated area under the curve (AUC) values of 0.73 and 0.62, respectively. Focusing on the patients with EF greater than 60%, the corresponding ROC analysis AUC values are 0.79 and 0.48 for the Deltacenter and raw EF values, respectively.

Discussion
Possible Flow Index association with MACE
The Flow Index presented here was derived from conditions measured in the aorta in the development population and was predictive of EF with a distinct periodic pattern repeating approximately every 10 EF points. In the illustration population we noted that MACE rates exhibited a clear pattern of increased MACE at EF positions separated by approximately 10 points. Further, for the illustration population, we characterized the distance from the central position within each EF band between the MACE peak response positions, and showed that it was more predictive of MACE than the raw EF value. These data are strongly suggestive that MACE rates are related to impedance conditions, but the exact relationship cannot be determined from this data. Solomon et al. noted that above 45%, EF has no predictive value in heart failure patients (7), which is consistent with the data presented here, where for the range 60–79% EF had a negligible predictive value. Nevertheless, high MACE rates may still be expected in patients with preserved EF as noted by Owan et al. (8). Here we observed that distance from a central position within each EF band (Deltacenter) for women with preserved EF was predictive of MACE. It is reasonable to suppose that this may correspond to a certain condition of the Flow Index, but we note that while the Flow Index can be used to derive the LVEF, knowledge of EF does not allow us to unambiguously calculate the Flow Index due to the inherent limits on accuracy in measuring EF. Consider that in transitioning from an EF of 69% to 71%, conditions may correspond to transitioning over a resonance band boundary or they might correspond to the subject remaining in the same EF band (Figure 1). However, when measuring the Flow Index directly, for the same change in EF, whether the subject remains within a resonance band or transitions to another band is clearly discernible in the smooth vs. sudden transition of the Flow Index. Thus, while Flow Index relates to EF (equation 4), knowledge of EF does not allow unambiguous calculation of the Flow Index. Consequently, because aortic flow is not typically measured with traditional imaging modalities and protocols, this phenomena has not been previously observed, and currently, the AHA/ACC guidelines for assessment of risk for of cardiovascular disease do not recommend differentiating patients based on aortic flow conditions (9,10).
Flow Index matching to EF
The concept of modeling the efficiency of cardiac ejection has been extensively approached from the ventricular performance side (11). For instance, Yotti et al. (12) noted that often EF is an inadequate metric for ventricular assessment due to differences in loading conditions. They found that the interventricular pressure differences that occurred during peak ejection strongly correlate with the more fundamental measure of maximal myocardial elastance over a wide range of conditions. Interestingly, their model incorporated the velocity of ejected blood and the ejection time assessed at the level of the LV outflow tract, which are similar to the parameters contributing to the aortic-derived Flow Index described here. In the development population we showed that while EF varied in a smoothly continuous manner over consecutive Flow Index bands, the Flow Index demonstrated a sudden discontinuity at band boundaries. Further, the Flow Index likely indicates the net result of adjustments made by the cardiac and vascular systems which has potential to accommodate a variety of cardiac loading conditions.
Physiologic response of Flow Index variables
As shown in the development population, as the transition is made from one EF band to another, the individual components of the Flow Index make sudden, discontinuous changes at both the upper and lower boundaries of each band. In particular the aortic area makes a large transition (e.g., form a high cross sectional area to a low cross sectional area). The data presented here represent a cross-sectional view of conditions for 112 individuals in the development population. However, we have no information on how physiologic conditions vary to affect the transition between resonant bands for an individual. Rosen et al. indicated that the transition from compensatory concentric remodeling to myocardial failure is not completely understood (13) and further distinction is made between systolic and diastolic heart failure (14). In the Multi-Ethnic Study of Atherosclerosis, Lilly et al. showed that alternations in the large conduit vessels, rather than changes in microvascular resistance, are primarily related to the incident cardiovascular disease (15), which is consistent with the large changes in aortic area noted during transition between bands. Boom et al. (16) have shown that there is interplay between ejection volume, blood velocity and pressure. Further, Lam et al. (17) have shown that high flow conditions affect vasorelaxation via the generation of nitric oxide, which again may influence both capacitive and inductive impedance components that influence the Flow Index. Under experimental conditions, Chang et al. (18) administered streptozotocin to rats to induce diabetes and observed that paradoxically as the maximal myocardial elastance reduced, the blood flow velocity increased, which in this model is consistent with transitioning to a lower Flow Index band. In a similar experiment, Yeih et al. (19) demonstrated that early responses to failure involve increases in blood velocity, and over time as velocity decreases a period of preserved function is observed, only to subsequently decline as velocity decreases, which is well explained in terms of the Flow Index model. Chang et al. (20) demonstrated that as rats age, at 24 months, maximal flow velocity increased, which is consistent with adjustments of Flow Index that occur within a single band. Davies et al. (21) have shown that an excess pressure integral index that can be derived from dynamic blood pressure data is associated with high event rates. Since pressure gradient is a driver of flow, this likely corresponds to conditions directly described by the Flow Index, which importantly, can be derived from flow conditions and which may be easier to obtain non-invasively.
Limitations
The Flow Index was derived in a population of men and women, while the prognostic data were obtained in an exclusively female population characterized by EF, which only indirectly relates to the Flow Index. Modeling the EF in 6 bands, even with a poor model, would produce a very good correlation with the measured EF (since the goodness of fit is dominated by the high data range). However, confidence in the Flow Index model is reinforced when considering that in the development population each EF band had a width of approximately 10 EF points, and that in the illustration population regions of high MACE rates were separated by approximately 10 EF points, especially in the sub group with EF >60%. However, further work is needed to relate the occurrence of MACE with respect to the exact Flow Index conditions, and to determine if there are characteristic differences in this index between men and women. The present study focused on LV systolic function, with no specific consideration of diastolic properties. Zile et al. have speculated that alterations in arterial stiffness may also affect properties of active relaxation and passive stiffness (22). Further studies will be needed to determine these interrelationships and their clinical prognostic value.
Conclusions
In a development population we have shown that a Flow Index can be used as a measure of impedance of LV ejection and that it can be derived from measurements of aortic flow. The Flow Index can be used to derive EF and exhibits characteristics of a resonance phenomenon. In a separate exclusively female illustrative population with only a measurement of EF available, the occurrence of MACE exhibited a periodic nature. Further investigation is needed to characterize the Flow Index, determine its exact relationship to MACE, and to determine how it transitions for an individual.
Acknowledgements
Funding: This work was supported by contracts from the National Heart, Lung and Blood Institutes, nos. N01-HV-68161, N01-HV-68162, N01-HV-68163, N01-HV-68164, R01-HL-073412-01, grants U0164829,U01 HL649141, U01 HL649241, and grants from the Gustavus and Louis Pfeiffer Research Foundation, Danville, New Jersey, The Women’s Guild of Cedars-Sinai Medical Center, Los Angeles, California, The Ladies Hospital Aid Society of Western Pennsylvania, Pittsburgh, Pennsylvania, and QMED, Inc., Laurence Harbor, New Jersey, and the Edythe L. Broad Endowment, the Barbra Streisand Women’s Cardiovascular Research and Education Program, the Linda Joy Pollin Women’s Heart Health Program, Cedars-Sinai Medical Center, Los Angeles. The content is solely responsibility of the authors and does not reflect the official view of the NHLBI.
Footnote
Conflicts of Interest: The authors have no conflicts of interest to declare.
Ethical Statement: This study was approved by the institutional review board (IRB) [study number: RC-1717; study title: WISE Study (Women’s Ischemic Syndrome Evaluation)], and written informed consent was obtained from all patients.
References
- Alastruey J, Parker KH and Sherwin SJ. Arterial pulse wave haemodynamics 11th International Conference on Pressure Surges: Virtual PiE Led t/a BHR Group; 2012:401-43.
- Campbell KB, Simpson AM, Campbell SG, et al. Dynamic left ventricular elastance: a model for integrating cardiac muscle contraction into ventricular pressure-volume relationships. J Appl Physiol 2008;104:958-75. [Crossref] [PubMed]
- Suinesiaputra A, Bluemke DA, Cowan BR, et al. Quantification of LV function and mass by cardiovascular magnetic resonance: multi-center variability and consensus contours. J Cardiovasc Magn Reson 2015;17:63. [Crossref] [PubMed]
- Elzinga G, Westerhof N. Pressure and flow generated by the left ventricle against different impedances. Circ Res 1973;32:178-86. [Crossref] [PubMed]
- Doyle M, Weinberg N, Pohost GM, et al. Prognostic value of global MR myocardial perfusion imaging in women with suspected myocardial ischemia and no obstructive coronary disease: results from the NHLBI-sponsored WISE (Women's Ischemia Syndrome Evaluation) study. JACC Cardiovasc Imaging 2010;3:1030-6. [Crossref] [PubMed]
- Merz CN, Kelsey SF, Pepine CJ, et al. The Women’s Ischemia Syndrome Evaluation (WISE) Study: protocol design, methodology and feasibility report. J Am Coll Cardiol 1999;33:1453-61. [Crossref] [PubMed]
- Solomon SD, Anavekar N, Skali H, et al. Influence of Ejection Fraction on Cardiovascular Outcomes in a Broad Spectrum of Heart Failure Patients. Circulation 2005;112:3738-44. [Crossref] [PubMed]
- Owan TE, Hodge DO, Herges RM, et al. Trends in prevalence and outcome of heart failure with preserved ejection fraction. N Engl J Med 2006;355:251-9. [Crossref] [PubMed]
- Greenland P, Alpert JS, Beller GA, et al. 2010 ACCF/AHA guideline for assessment of cardiovascular risk in asymptomatic adults: a report of the American College of Cardiology Foundation/American Heart Association Task Force on Practice Guidelines. J Am Coll Cardiol 2010;56:e50-103. [Crossref] [PubMed]
- Mozaffarian D, Benjamin EJ, Go AS, et al. Heart disease and stroke statistics--2015 update: a report from the American Heart Association. Circulation 2015;131:e29-322. [Crossref] [PubMed]
- Burkhoff D, Mirsky I, Suga H. Assessment of systolic and diastolic ventricular properties via pressure-volume analysis: a guide for clinical, translational, and basic researchers. Am J Physiol Heart Circ Physiol 2005;289:H501-12. [Crossref] [PubMed]
- Yotti R, Bermejo J, Benito Y, et al. Validation of noninvasive indices of global systolic function in patients with normal and abnormal loading conditions: a simultaneous echocardiography pressure-volume catheterization study. Circ Cardiovasc Imaging 2014;7:164-72. [Crossref] [PubMed]
- Rosen BD, Edvardsen T, Lai S, et al. Left ventricular concentric remodeling is associated with decreased global and regional systolic function: the Multi-Ethnic Study of Atherosclerosis. Circulation 2005;112:984-91. [Crossref] [PubMed]
- van Heerebeek L, Borbely A, Niessen HW, et al. Myocardial structure and function differ in systolic and diastolic heart failure. Circulation 2006;113:1966-73. [Crossref] [PubMed]
- Lilly SM, Jacobs D, Bluemke DA, et al. Resistive and pulsatile arterial hemodynamics and cardiovascular events: the Multiethnic Study of Atherosclerosis. J Am Heart Assoc 2014;3:e001223. [Crossref] [PubMed]
- Boom HB, Wijkstra H. The step response of left ventricular pressure to ejection flow: a system oriented approach. Ann Biomed Eng 1992;20:99-126. [Crossref] [PubMed]
- Lam CF, Peterson TE, Richardson DM, et al. Increased blood flow causes coordinated upregulation of arterial eNOS and biosynthesis of tetrahydrobiopterin. Am J Physiol Heart Circ Physiol 2006;290:H786-93. [Crossref] [PubMed]
- Chang KC, Lo HM, Tseng YZ. Systolic elastance and resistance in the regulation of cardiac pumping function in early streptozotocin-diabetic rats. Exp Biol Med (Maywood) 2002;227:251-9. [PubMed]
- Yeih DF, Lin LY, Yeh HI, et al. Temporal changes in cardiac force- and flow-generation capacity, loading conditions, and mechanical efficiency in streptozotocin-induced diabetic rats. Am J Physiol Heart Circ Physiol 2008;294:H867-74. [Crossref] [PubMed]
- Chang KC, Peng YI, Dai SH, et al. Age-related changes in pumping mechanical behavior of rat ventricle in terms of systolic elastance and resistance. J. Gerontol A Biol Sci Med Sci 2000;55:B440-7. [Crossref] [PubMed]
- Davies JE, Lacy PS, Cruickshank K, et al. Excess pressure is higher in atenolol-treated individuals and independently predicts cardiovascular events in the CAFE substudy of ASCOT Eur Heart J 2010;31:902. [PubMed]
- Zile MR, Baicu CF, Gaasch WH. Diastolic heart failure--abnormalities in active relaxation and passive stiffness of the left ventricle. N Engl J Med 2004;350:1953-9. [Crossref] [PubMed]

