
Numerical analysis of the effect of turbulence transition on the hemodynamic parameters in human coronary arteries
Introduction
The leading causes of death and disability in the western world are disorders related to the vascular system (1). Annually, coronary artery diseases (CAD) are responsible for 7.3 million deaths and 58 million disability-adjusted life years lost worldwide (2). Since in vivo measurements of the wall shear stress (WSS) and other hemodynamic parameters are difficult to perform in the artery, computational fluid dynamics (CFD) technique has been used as an effective alternative to calculate various hemodynamic parameters and blood constituents near the coronary wall. The typical Reynolds number range of blood flow through coronary arteries varies from few tens to approximately 4,000 in the aorta (3). Steady laminar flow through a circular pipe becomes unsteady at a Reynolds number of 2,000 and transition into fully turbulent flow occurs at about 4,000 (4). However, due to the presence of the stenosis, curvature effects and the pulsatile nature of the blood flow through arteries, transition to turbulence can occur even at much lower Reynolds number (5,6).
Because of the flow complexity and time involved in solving full Navier-Stokes equation, most previous studies have made appropriate assumptions. Some assumed the blood flow in coronary arteries to be laminar (7-14) and behave as Newtonian fluid (8,15-17) and some studied turbulence transition and non-Newtonian effects considering idealized straight arterial model with single model stenosis obstruction (11,15,17-21). Several experimental investigations have been carried out on flow disturbances in the downstream region of idealized modeled stenosis (18,22,23). Ahmed and Giddens (24) examined the development of flow disturbances downstream of smooth 25%, 50% and 75% area reductions in an idealized geometry and observed a substantial increase in the disturbance level above 50% stenosis. Beratlis et al. (18) conducted both numerical and experimental investigation of transitional pulsatile flow in a prototypical stenotic site giving a blockage ratio of 50% and Reynolds number of 570. They used direct numerical simulations (DNS) to study the flow disturbances downstream of the constriction and observed that distal region is dominated by alternating random fluctuations. The Reynolds number in cardiovascular system is lower when compared to larger arteries like carotid and aorta due to reduced blood flow rate and smaller diameter of coronary arteries (25). Hence it is generally assumed to be laminar for smaller coronary arteries like left main artery (LM), left circumflex artery (LCX), left anterior descending artery (LAD) and right coronary artery (RCA).
The above CFD studies have addressed pulsatile blood flows in stenotic coronary arteries accounting fluid-structure interaction, transition to turbulence, non-Newtonian effects and even plaque morphology. However, the arterial models considered were limited either to an idealized geometry, without curvature and/or for a particular percentage stenosis in large arteries like carotid or aorta. Transitional shear stress transport (SST) k-ω turbulence model is utilized here to capture the flow transition, if any, to turbulent state. Transitional SST k-ω model has been found to capture turbulence transition and predict WSS better than standard RANS based turbulence models (19,21,26). The onset of turbulent transition during pulsatile flow through coronary arteries is quantitatively analysed by calculating the turbulent kinetic energies at distal locations for varying degree of stenosis. Disturbances in the arterial blood flow due to turbulence can influence the physiological parameters and processes, such as pressure loss, WSS, wall pressure, mass transport from the blood to the vessel wall and wall remodeling (27,28). Hence, it is of clinically relevance to quantify the effect of turbulence transition on hemodynamic parameters such as WSS and oscillatory shear index (OSI) for varying degree of stenosis.
In the present study, first according the authors, the effect of laminar assumption on WSS and OSI predictions has been investigated for blood flow through simulated coronary arteries with varying degree of stenosis (i.e., 0%, 30%, 50% and 70% stenosis). The present work contributes towards an improvement in the CFD model that is adapted in clinical studies resulting in better prediction of WSS, OSI, CFR and FFR.
Methods
In this section we present the construction of 3-D artery model, boundary conditions and numerical methods used to simulate the blood flow through coronary arteries.
In vivo coronary artery models: IVUS imaging and geometry reconstruction
Intravascular ultrasound (IVUS) imaging with tissue characterization is considered as gold standard in evaluating progression or regression of plaques (29). In vivo IVUS images obtained from patients was used in the present study with consent. A total of 146 patients were selected from 160 patients in a single-center study (30) who underwent percutaneous coronary interventions. After the intra coronary administration of vasodilator, a 40-MHz IVUS catheter (Atlantis SR Pro; Boston Scientific) was used to acquire the IVUS images. Approval to conduct the study was obtained from the ethics committee at Toho University, Japan, and written informed consent was provided by all participants. Stenotic geometries of sample patients were taken from this pool.
The study included 146 patients (126 males, 20 females) with mean age 69.6±9.9 years. Mean HbA1c, LDL, HDL and total Cholesterol of patients were 5.83±0.32, 97.22±34.07, 51.12±14.77 and 173.52±41.15 mg/dL, respectively (31). In-house software for atherosclerotic plaque imaging analysis (ImgTracerTM, courtesy of AtheroPoint, Roseville, CA, USA) was used to calculate intima-media thickness. A web-based system was developed to manually generate contour plots of lumen [internal elastic lamina (IEL)] and the vessel outer wall [external elastic lamina (EEL)]. A Python script was used to concatenate data from different sections into one single file which was read as formatted data points in ICEM CFD preprocessing software. The artery was then reconstructed using the multi-section solid command in CATIA V5 CAD software. IVUS can only provide 2-D cross-sectional images and additional imaging modalities like CT scans and X-ray angiography is required to get the 3-D curvature. In the present investigation, 3-D centerline curvature of LCX was reconstructed from the published multi-slice CT angiography of a left coronary segment (32). The reconstructed 3-D in vivo arterial geometrical models for 0%, 30%, 50% and 70% stenosis are shown in Figure 1.

Boundary conditions
Periodical pulsatile volume inflow profiles were applied as velocity inlet boundary conditions. The phasic inflow coronary velocity waveform for the left coronary artery (LCA), obtained from Berne and Levy, (33) is used in the present study as shown in Figure 2. Outflow condition was used at the outlet with a flow weighting of 1. Inlet turbulent intensity of 3% typically seen in coronary arteries is considered for the current simulations (11). A stationary wall with ‘no slip’ condition was used to simulate the arterial wall. At the inlet, the flow Reynolds number reaches a maximum value of 410 based on the inlet diameter of the artery during peak systole.

Computational mesh
The computational mesh was generated using ICEM CFD commercial package. The robust scheme was adapted for mesh generation. The final mesh had 516,000 elements (Figure 3A). A prism layer consisting of 4 layers with a height ratio of 1.2 was employed to capture the flow near the wall (Figure 3B). In the present model the value of y+ for the first grid away from the wall is 0.5 as required by the turbulent transition model.

Inlet and outlet sections were extended by 5 times the vessel diameter in proximal and distal directions, respectively to satisfy the computational ‘Outlet’ boundary condition while ensuring smooth entry. Four cardiac cycles were simulated for each transient simulation in order to ensure statistical convergence or periodicity. It was however observed that after first cardiac cycle the results showed exact periodicity. For presentation of the results, we analyzed the data from second cardiac cycle.
Governing equations
The blood flow in coronary arteries is governed by Navier-Stokes’ Eq. [1,2] (34). Finite volume method (FVM) based commercial CFD software ANSYS 15.0 (35) was used to carry out the computational investigations. The blood flow is assumed to be unsteady, isothermal and incompressible. The ensemble-averaged governing equations solved for mass and momentum conservation are:
- Continuity: the continuity equation is based upon the mass conservation principle and a general form can be written as
- Momentum: the momentum equation is based upon the momentum conservation principle (Newton’s second law) and a general form can be written as


Where, Ui is the mean velocity vector, p is the static pressure, ρ is the fluid density and ν the kinematic viscosity. For turbulent flows, the time-averaging process produces the unknown Reynolds stresses  which are to be modeled using turbulence theory. In laminar flows the Reynolds stresses are almost zero.
Transitional shear stress transport (SST) k-ω turbulence model
Moderate to severe arterial stenosis can produce highly disturbed flow regions distal to stenosis with transitional and/or turbulent flow characteristics. Neither laminar flow modeling nor Reynolds Averaged Navier-Stokes (RANS) based turbulence models that are developed for fully turbulent flows are suitable for this kind of flows (36-38). The turbulence model utilized here is the transitional shear stress transport (SST) k-ω model designed to capture the transition, if any, to turbulent state (19,21,26). The transitional model solves the SST k-ω transport equations with two more equations, viz., Eq. [3,4]; one for intermittency and one for transition onset criteria, in terms of momentum-thickness Reynolds number. The model utilizes empirical correlation based strategy to take in to account the effect of pressure gradient, external turbulence level and transitional length on turbulent transition and local flow parameters. Further details of this model with validation and justification of using this model in physiological flow conditions were reported by (26).
The transport equations for k and ω are
Where Γ represents effective diffusivity, G is the generation term, Y is the diffusion term and D represents the cross-diffusion.
Carreau non-Newtonian model: WSS and OSI
The hemodynamic conditions in the cardiovascular system are also influenced by the molecular viscosity of the blood. The application of non-Newtonian model for the cardiovascular flow analysis is crucial for achieving good results (39). The molecular viscosity according to Carreau model (40) is given by:
where time constant λ=3.313s; Power law index n=0.3568; zero shear viscosity μ0 =0.056 kg/m-s; infinite shear viscosity μ∞ =0.00345 kg/m-s and  is the shear rate.
For incompressible fluids and non-slip conditions applied to the arterial wall, the spatial WSS τw is calculated as:

where μ is the dynamic viscosity, μt is the tangential to the wall velocity and n is the unit vector perpendicular to the wall.
The OSI accounts for departure of instantaneous WSS from its time averaged value. The oscillating shear index (OSI) indicates the intensity of the oscillation around zero throughout the cycle, which can be expressed as (41):
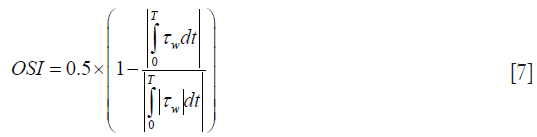
where T is the cardiac cycle, τw is the temporal WSS vector. OSI values range between 0 and 0.5, where 0.5 indicates a purely oscillatory flow. There are studies suggesting the intensively oscillating WSS causes the fatigue lesions of the arterial intima and further the atherosclerosis and arterial stenoses (3).
Model validation and verification
Model validation
For the validation purpose, pulsatile flow field distal to a 75% axisymmetric constriction in a straight tube was simulated using transitional SST k-ω model and compared with the experimental data of (24). The idealized stenosed geometry is shown in Figure 4. The experimental inlet wave form in Figure 5 is utilized in ANSYS FLUENT by using User Defined Function (UDF). Blood was modeled as an incompressible Newtonian liquid with density ρ=1,000 kg/m3 and dynamic viscosity µ=0.0036014 kg/ms. The mean velocity, U0, of the inflow profile used for the simulations was 0.04254 m/s and the mean Reynolds number for the simulations was 600. The peak and minimum Reynolds numbers were 996 and 204 respectively. The Womersley number, α, was approximately 7.5.


Velocity profile comparisons
Velocity profiles obtained using simulations at time ‘T2’ are compared with Ahmed et al., (24) experimental data and plotted in Figure 6. The transitional k−ω turbulence model shows good agreement against the experimental data from Ahmed et al., (24) for the data recorded at 1D and 1.5D downstream of the stenosis. Comparing the computed and measured centerline velocity, the transitional k−ω turbulence model is able to predict the distal flow field with 95% accuracy. This is achieved by the two additional transport equations used along the equations for turbulent kinetic energy (k) and specific dissipation rate of turbulent kinetic energy (ω). The two additional equations are solved for turbulent intermittency and momentum Reynolds number. Detailed formulation and validations for transitional flows were reported by (Menter et al., 2006) (27).

Verification
Apart from validation, verification process assesses whether the numerical model is correctly implemented by comparing the model’s numerical results against the analytical results. It also involves sensitivity analysis of the input parameters to the numerical model.
Mesh independence
Mesh independence was investigated by comparing the WSSmax at peak systole with the following three different meshes: coarse, medium and fine mesh corresponding to 258,000, 516,000 and 774,000 mesh control volumes respectively. Table 1 gives the details of the mesh independence test by providing the WSSmax for various mesh volumes used. The table also gives the percentage (%) change in WSSmax as the number of mesh volumes increases.

Full table
Temporal independence
A time-step independence test was carried out with 15, 75, and 150 time-steps per cycle which corresponds to 0.05, 0.01 and 0.005 seconds respectively by comparing the WSSmax at peak systole during a cardiac cycle. Table 1 gives the details of the time step independence test by providing the WSSmax for various time step used. The table also gives the % change in WSSmax as the time step is reduced.
Convergence criteria
Numerical simulation methodology involves iterative procedures and hence convergence criteria have to be set up for the conserved flow properties. Convergence criteria of 10−4 and 10−5 which is the final difference between the analytical solution and the iterative solution have been set up for the mass conservation (Eq. [1]) and momentum conservation (Eq. [2]) equations respectively.
Results
In order to assess quantitatively the onset of turbulence, simulations based on laminar and turbulent model are carried out for varying degree of stenosis and the hemodynamics parameters are compared. In the present methodology, the following assumptions are adapted: (I) arterial wall is non-elastic; (II) cardiac movements are neglected; (III) viscosity of the blood is a function of shear rate only.
Comparison between straight and curved geometry
The effect of 3-D centerline curvature on the WSS is numerically studied. The 0% stenosis artery geometry with and without 3-D centerline curvature (Figure 1A and a constant cross-section artery with straight centerline) was considered. Figure 7 gives WSSavg and WSSmax during a cardiac cycle for both the geometries mentioned above. WSSavg is area weighted average of the WSS (Eq. [6]) over the entire arterial lumen surface at a particular time in a cardiac cycle and WSSmax is the maximum value of WSS (Eq. [6]) over the entire arterial lumen surface at a particular time in a cardiac cycle. It can be seen that WSSavg and WSSmax is consistently less compared to the artery with curvature throughout the cycle. Table 2 gives the percentage deviation in WSSavg and WSSmax for curved artery from the straight artery along with absolute difference in Pascal.


Full table
WSS predictions using turbulent and laminar models
The transitional SST k-ω model is capable of taking into account additional stresses due to turbulence, if any, through the Reynolds stress term in the governing equation (Eq. [2]). To determine whether the flow has transition/turbulent zones, the hemodynamic parameters obtained by turbulent transitional model are compared with the laminar model. The calculated WSSavg and WSSmax based on laminar and turbulent model considering blood as non-Newtonian fluid (Eq. [5]) for all arterial geometries are plotted in Figure 8.

Table 3 present the deviations of turbulence transition model from the laminar model in the calculated WSSavg and WSSmax values and clearly shows that the difference between the absolute values for laminar and turbulent models increases almost exponentially with the stenosis. As the turbulence level in the blood flow increases the values of WSS increases due to increase in the velocity gradient at wall. Figure 9 presents the WSS distribution obtained using the turbulence model for all the stenosis geometry. At the throat (stenosis) WSS is maximum and increases downstream after the stenosis as the flow becomes highly disturbed due to the presence of obstruction.

Full table

Oscillatory shear index (OSI)
OSI calculated using Eq. [7] at a location downstream of the maximum stenosis and averaged over a complete cycle is plotted in Figure 10. It can be inferred from the figure that the OSI varies significantly between the laminar and turbulent models for 50% and 70% stenosis indicating that the transition to turbulence starts occurring above 50% stenosis.

Onset of turbulence
A comparison of turbulent kinetic energy as a percentage of mean flow kinetic energy along the radius at a location 2 inlet diameters distal to the stenosis is plotted in Figure 11. It can be observed that the turbulence intensity increases significantly for 70% stenosis compared to 50% or lower stenosis which indicates that the flow becomes turbulent at peak velocity for 70% stenosis.

Discussion
Our model, validation and assumptions
The pulsatile blood flow through coronary arteries under multiple-stenosis condition could undergo transition from laminar to turbulent. Transitional SST k-ω model was developed for transitional flows. This has been validated and utilized to capture turbulence transition in coronary arteries. We demonstrated that the flow transition affects the clinically relevant hemodynamic parameters such as WSS and OSI for stenosis above 50% and the flow becomes fully turbulent for 70% stenosis. It is assumed that the artery is made of rigid wall and the effect of cardiac motion on the geometry is neglected.
Brief survey and benchmarking
In numerical coronary hemodynamic analysis, the blood flow is generally assumed to be laminar. Though, there is general consensus on transition to turbulence occurring in large arteries under stenotic conditions, there is no literature available on turbulence transition studies in 3-D transient pulsatile coronary arteries for varying degree of stenosis including centerline curvature and considering blood as non-Newtonian (Table 4). Viscosity of blood increases markedly at low shear rates. In the present investigation the Carreau model was used to model this non-Newtonian behavior in order to improve the accuracy of WSS predictions in coronary arteries. Our present work was aimed to provide quantitatively the onset of turbulence in simulated coronary arteries which would help in making informed choice on laminar/turbulent assumption resulting in better WSS predictions. Transitional SST k-ω turbulence model is utilized here to capture the flow transition, if any, to turbulent state. First, the model is validated against the widely benchmarked experimental results of Ahmed et al., (24) for 75% stenosis where the flow Reynolds number varies from 200 to 1,000. Ahmed et al., (24) observed flow transition to turbulent at location distal to the 75% stenosis. Hence, the measured velocity profiles at distal locations were chosen for validating the transitional SST k-ω turbulence model. The model was able to predict the velocity profile behind the stenosis accurately (Figure 6). This is achieved by solving two additional equations; one for turbulent intermittency and the other for transition momentum Reynolds number (26,44).

Full table
A Note on the effect of coronary geometry
First, comparison was made between straight and in vivo coronary artery with 0% stenosis to quantify the effect of 3-D centerline curvature on WSS. While comparing the calculated hemodynamics parameters, it was observed that the centerline curvature significantly affects the WSS (122% for WSSmax and 50% for WSSavg). It can also be seen that WSSavg and WSSmax is consistently less compared to the artery with curvature throughout the cycle. In vivo coronary arteries are tortuous in nature with multiple bends, twists and windings. In every bend WSS tends to be high on the outer radius and low on the inner radius due to the centrifugal force acting on the blood flow hence the WSSavg and WSSmax increases significantly from that of straight model.
WSS and OSI: comparison between laminar and turbulent models
In results section, the effect of laminar flow assumption on WSS and OSI predictions was investigated for blood flow through simulated coronary arteries with varying degree of stenosis (i.e., 0%, 30%, 50% and 70%). Figure 8, Figure 9 and Table 3 clearly demonstrate that the laminar model under-predicts the WSS and the change in WSS value increases with increase in the severity of stenosis. As the turbulence level in the blood flow increases the values of WSS increases due to increase in the velocity gradient at wall. The values of WSSavg and WSSmax based on turbulent model are consistently higher than the laminar model for all stenotic geometries during the peak systole. Hence, the flow is turbulent during the peak systole irrespective of stenosis value. The difference in WSSmax is considerably less than that for WSSavg between the two modeling approaches (Table 3). This is due to the fact that WSSmax occurs at the minimum cross section in a geometry and highly dependent on reduction in area and the flow rate and less dependent on the flow regime. WSSavg for a stenotic geometry on the other hand is significantly affected by the change in WSS distribution throughout the distal region of the stenosis due to turbulence transition.
A Note on effect of stenosis severity
It can be seen that for 0% and 30% stenosis, WSSavg, WSSmax and OSI calculated using laminar and turbulent model gives almost similar results throughout the entire cycle which manifests that the flow is laminar (Table 3) (Figure 10). However, for 50% and 70% stenosis, the calculated WSSavg, WSSmax and OSI shows substantial differences between the turbulent and laminar model confirming that significant turbulent zones exist in the blood flow. For 70% stenotic arterial model, the OSI is 0.3 distal to stenosis (Figure 10) which is considered as highly oscillatory flow. Low WSS and highly oscillatory blood flow sites are linked to atherogenesis and plaque progression (28). Hence, for higher degree of stenosis, using a turbulent model becomes important to accurately predict the WSSavg values as well as the spatial locations of low WSS. As plaque rupture is linked to critical flow and stress/strain conditions at the stenotic arterial cross section, the accuracy of the computational fluid models in predicting hemodynamic parameters is valuable and assistive in cardiac clinical decision support systems.
Onset of turbulence transition
Turbulent kinetic energy as a percentage of mean flow velocity along the radius at a location 2 inlet diameters distal to the stenosis is plotted in Figure 11. The turbulent kinetic energy approaches zero near the walls which is due to the dampening effect of velocity disturbances by the rigid walls. It can be observed that the turbulence intensity increases significantly for 70% stenosis and reaches 30% at the centre line compared to 3% for 50%. Based on the peak turbulent kinetic energy, transition from laminar to turbulent flow occurs between 50% and 70% stenosis and turbulence is established at 70% stenosis.
Strengths, weakness and extensions
The validated transitional shear stress transport (SST) k-ω model used in the present investigation is the best suited Reynolds averaged Navier-Stokes turbulence model to capture the transition, if any, to turbulent state. This study according to the authors presents for the first time the investigation of turbulence transition for varying degree of stenosis during a pulsatile blood flow through 3-D in vivo coronary arteries with centerline curvature and considering blood as non-Newtonian. Though specific patients from the sample pool were considered in this study, we intend to apply this more towards clinical applications on our own collaborative science.
However, the accuracy of transitional SST k-ω model to capture turbulent transition and turbulent zones depends upon the surface roughness value and the transition momentum thickness Reynolds number. Standard values have been assumed in the Eq. [3-6] for these constants. Since, these values are patient dependent the usage of in vivo measured values is expected to provide more accurate results. In the present methodology, the following assumptions are adapted: (I) arterial wall is non-elastic; (II) cardiac movements are neglected; (III) viscosity of the blood is a function of shear rate only. There is always a possibility of modeling these assumptions which leads to more accurate predictions.
It has been demonstrated that the transition to turbulence starts occurring above 50% stenosis. For non-Newtonian blood flow through in vivo coronary arteries with centerline curvature, turbulence affects the hemodynamic parameters like WSSavg, WSSmax and OSI significantly for stenosis above 70%. However, the onset of transition to turbulent flow seems to occur for 50% stenosis.
In the current study, we have demonstrated that the flow transition affects the clinically relevant hemodynamic parameters such as WSS and oscillatory shear stress (OSI). This concept was evaluated for coronary vessels having the stenosis above 30%. Further, we showed that the flow becomes fully turbulent above and beyond, if the vessel has 70% stenosis. In clinical cardiology, CFD models can be used to calculate coronary flow reserve (CFR) and fractional flow reserve (FFR). The present work contributes towards an improvement in the CFD model that is adapted in clinical studies resulting in better prediction of WSS, OSI, CFR and FFR. This is particularly helpful in understanding the patients which show early signs of cardiovascular disease and stroke. Such models are independent of the imaging modality. Even though, our model was based out of the IVUS, but this is extendable to CT-based coronary imaging.
Acknowledgements
None.
Footnote
Conflict of Interest: Dr. Jasjit S. Suri has a relationship with AtheroPoint™, Roseville, CA, USA which is dedicated to Atherosclerosis Disease Management including Stroke and Cardiovascular imaging. The other authors have no conflicts of interest to declare.
References
- Huang J, Lyczkowski RW, Gidaspow D. Pulsatile flow in a coronary artery using multiphase kinetic theory. J Biomech 2009;42:743-54. [Crossref] [PubMed]
- WHO. The world health report 2002 - Reducing Risks, Promoting Healthy Life. 2002.
- Ku ND. Blood flow in arteries. Annual Review of Fluid Mechanics. 1997;29:399-434. [Crossref]
- White FM. Viscous Fluid Flow, 2nd edition. NewYork: McGraw-Hill. 1991.
- Kandlikar SG, Garimella S, Li D, et al. Heat transfer and fluid flow in minichannels and microchannels. Kidlington, Oxford: Butterworth-Heinemann is animprint of Elsevier, 2014.
- Nichols W, O'Rourke M, Vlachopoulos C. McDonald's Blood Flow in Arteries, Sixth Edition: Theoretical, Experimental and Clinical Principles. CRC Press, 2011.
- Boutsianis E, Dave H, Frauenfelder T, et al. Computational simulation of intracoronary flow based on real coronary geometry. Eur J Cardiothorac Surg 2004;26:248-56. [Crossref] [PubMed]
- Dong J, Sun Z, Inthavong K, et al. Fluid-structure interaction analysis of the left coronary artery with variable angulation. Comput Methods Biomech Biomed Engin 2015;18:1500-8. [Crossref] [PubMed]
- Frauenfelder T, Boutsianis E, Schertler T, et al. In-vivo flow simulation in coronary arteries based on computed tomography datasets: feasibility and initial results. Eur Radiol 2007;17:1291-300. [Crossref] [PubMed]
- Johnston BM, Johnston PR, Corney S, et al. Non-Newtonian blood flow in human right coronary arteries: transient simulations. J Biomech 2006;39:1116-28. [Crossref] [PubMed]
- Nosovitsky VA, Ilegbusi OJ, Jiang J, et al. Effects of curvature and stenosis-like narrowing on wall shear stress in a coronary artery model with phasic flow. Comput Biomed Res 1997;30:61-82. [Crossref] [PubMed]
- Soulis JV, Giannoglou GD, Chatzizisis YS, et al. Non-Newtonian models for molecular viscosity and wall shear stress in a 3D reconstructed human left coronary artery. Med Eng Phys 2008;30:9-19. [Crossref] [PubMed]
- Su B, Huo Y, Kassab GS, et al. Numerical investigation of blood flow in three-dimensional porcine left anterior descending artery with various stenoses. Comput Biol Med 2014;47:130-8. [Crossref] [PubMed]
- Wu J, Liu G, Huang W, et al. Transient blood flow in elastic coronary arteries with varying degrees of stenosis and dilatations: CFD modelling and parametric study. Comput Methods Biomech Biomed Engin 2015;18:1835-45. [Crossref] [PubMed]
- Li MX, Beech-Brandt JJ, John LR, et al. Numerical analysis of pulsatile blood flow and vessel wall mechanics in different degrees of stenoses. J Biomech 2007;40:3715-24. [Crossref] [PubMed]
- Mallinger F, Drikakis D. Instability in three-dimensional, unsteady, stenotic flows. International Journal of Heat and Fluid Flow 2002;23:657-63. [Crossref]
- Bhaganagar K, Moreno C. Modeling of Stenotic coronary artery and implications of plaque morphology on blood flow. Modelling and Simulation in Engineering 2013;390313:1-14.
- Beratlis N, Balaras E, Parvinian B, et al. A numerical and experimental investigation of transitional pulsatile flow in a stenosed channel. J Biomech Eng 2005;127:1147-57. [Crossref] [PubMed]
- Ryval J, Straatman AG, Steinman DA. Two-equation turbulence modeling of pulsatile flow in a stenosed tube. J Biomech Eng 2004;126:625-35. [Crossref] [PubMed]
- Shalman E, Rosenfeld M, Dgany E, et al. Numerical modeling of the flow in stenosed coronary artery. The relationship between main hemodynamic parameters. Comput Biol Med 2002;32:329-44. [Crossref] [PubMed]
- Varghese SS, Frankel SH. Numerical modeling of pulsatile turbulent flow in stenotic vessels. J Biomech Eng 2003;125:445-60. [Crossref] [PubMed]
- Carew EO, Pedley TJ. An active membrane model for peristaltic pumping: Part I--Periodic activation waves in an infinite tube. J Biomech Eng 1997;119:66-76. [Crossref] [PubMed]
- Trip R, Kuik DJ, Westerweel J, et al. An experimental study of transitional pulsatile pipe flow. Physics of Fluids 2012;24:103-20. [Crossref]
- Ahmed SA, Giddens DP. Flow disturbance measurements through a constricted tube at moderate Reynolds numbers. J Biomech 1983;16:955-63. [Crossref] [PubMed]
- Wootton DM, Ku DN. Fluid mechanics of vascular systems, diseases, and thrombosis. Annu Rev Biomed Eng 1999;1:299-329. [Crossref] [PubMed]
- Tan FP, Soloperto G, Bashford S, et al. Analysis of flow disturbance in a stenosed carotid artery bifurcation using two-equation transitional and turbulence models. J Biomech Eng 2008;130:061008. [Crossref] [PubMed]
- Davies PF, Remuzzi A, Gordon EJ, et al. Turbulent fluid shear stress induces vascular endothelial cell turnover in vitro. Proc Natl Acad Sci U S A 1986;83:2114-7. [Crossref] [PubMed]
- Slager CJ, Wentzel JJ, Gijsen FJ, et al. The role of shear stress in the generation of rupture-prone vulnerable plaques. Nat Clin Pract Cardiovasc Med 2005;2:401-7. [Crossref] [PubMed]
- Zhang JM, Zhong L, Su B, et al. Perspective on CFD studies of coronary artery disease lesions and hemodynamics: a review. Int J Numer Method Biomed Eng 2014;30:659-80. [Crossref] [PubMed]
- Araki T, Nakamura M, Utsunomiya M, et al. Visualization of coronary plaque in arterial remodeling using a new 40-MHz intravascular ultrasound imaging system. Catheter Cardiovasc Interv 2013;81:471-80. [Crossref] [PubMed]
- Araki T, Nakamura M, Utsunomiya M, et al. Visualization of coronary plaque in type 2 diabetes mellitus patients using a new 40 MHz intravascular ultrasound imaging system. J Cardiol 2012;59:42-9. [Crossref] [PubMed]
- Xie X, Wang Y, Zhu H, et al. Computation of hemodynamics in tortuous left coronary artery: a morphological parametric study. J Biomech Eng 2014;136:101006. [Crossref] [PubMed]
- Berne R, Levy M. Cardiovascular Physiology. 3rd Edition. Mosby, St. Louis, 1967.
- Anderson J. Computational Fluid Dynamics. New York: McGraw-Hill Education, 1995.
- Ansys fluent 15.0. fluent User’s Guide. ANSYS Inc 2013.
- Arun M, Tulapurkara EG. Computation of turbulent flow inside an enclosure with central partition. Progress in computational fluid dynamics an international journal 2005;5:455-65.
- Banks J, Bressloff NW. Turbulence modeling in three-dimensional stenosed arterial bifurcations. J Biomech Eng 2007;129:40-50. [Crossref] [PubMed]
- Ghalichi F, Deng X, De Champlain A, et al. Low Reynolds number turbulence modeling of blood flow in arterial stenoses. Biorheology 1998;35:281-94. [Crossref] [PubMed]
- Soulis JV, Farmakis TM, Giannoglou GD, et al. Wall shear stress in normal left coronary artery tree. J Biomech 2006;39:742-9. [Crossref] [PubMed]
- Cho YI, Kensey KR. Effects of the non-Newtonian viscosity of blood on flows in a diseased arterial vessel. Part 1: Steady flows. Biorheology 1991;28:241-62. [PubMed]
- Buchanan JR Jr, Kleinstreuer C, Truskey GA, et al. Relation between non-uniform hemodynamics and sites of altered permeability and lesion growth at the rabbit aorto-celiac junction. Atherosclerosis 1999;143:27-40. [Crossref] [PubMed]
- Long Q, Xu XY, Ramnarine KV, et al. Numerical investigation of physiologically realistic pulsatile flow through arterial stenosis. J Biomech 2001;34:1229-42. [Crossref] [PubMed]
- Mamun Molla M, Wang BC, Kuhn DC. Numerical study of pulsatile channel flows undergoing transition triggered by a modelled stenosis. Phys. Fluids 2012;24:121901-25. [Crossref]
- Menter FR, Langtry RB, Likki SR, et al. A correlation-based transition model using local variables-Part I: Model formulation. J Turbomach 2006;128:413-22. [Crossref]

